Prediction (out of sample)
[1]:
%matplotlib inline
[2]:
import numpy as np
import matplotlib.pyplot as plt

import statsmodels.api as sm

plt.rc("figure", figsize=(16, 8))
plt.rc("font", size=14)
Artificial data
[3]:
nsample = 50
sig = 0.25
x1 = np.linspace(0, 20, nsample)
X = np.column_stack((x1, np.sin(x1), (x1 - 5) ** 2))
X = sm.add_constant(X)
beta = [5.0, 0.5, 0.5, -0.02]
y_true = np.dot(X, beta)
y = y_true + sig * np.random.normal(size=nsample)
Estimation
[4]:
olsmod = sm.OLS(y, X)
olsres = olsmod.fit()
print(olsres.summary())
                            OLS Regression Results
==============================================================================
Dep. Variable:                      y   R-squared:                       0.986
Model:                            OLS   Adj. R-squared:                  0.985
Method:                 Least Squares   F-statistic:                     1064.
Date:                Wed, 02 Nov 2022   Prob (F-statistic):           1.74e-42
Time:                        17:06:17   Log-Likelihood:                 4.4594
No. Observations:                  50   AIC:                           -0.9188
Df Residuals:                      46   BIC:                             6.729
Df Model:                           3
Covariance Type:            nonrobust
==============================================================================
                 coef    std err          t      P>|t|      [0.025      0.975]
------------------------------------------------------------------------------
const          4.9488      0.079     62.924      0.000       4.791       5.107
x1             0.5124      0.012     42.246      0.000       0.488       0.537
x2             0.6093      0.048     12.778      0.000       0.513       0.705
x3            -0.0216      0.001    -20.250      0.000      -0.024      -0.019
==============================================================================
Omnibus:                        6.272   Durbin-Watson:                   2.752
Prob(Omnibus):                  0.043   Jarque-Bera (JB):                5.171
Skew:                           0.723   Prob(JB):                       0.0754
Kurtosis:                       3.625   Cond. No.                         221.
==============================================================================

Notes:
[1] Standard Errors assume that the covariance matrix of the errors is correctly specified.
In-sample prediction
[5]:
ypred = olsres.predict(X)
print(ypred)
[ 4.40969647  4.94512482  5.43363276  5.84201378  6.14904543  6.34897612
  6.45247004  6.48485512  6.48196167  6.48423561  6.53009328  6.64960978
  6.85957769  7.16074809  7.53770719  7.96140876  8.39394633  8.79478112
  9.12740246  9.36532639  9.49644688  9.52502482  9.470988    9.36665699
  9.25143498  9.16533394  9.14240078  9.20512354  9.36073664  9.60003232
  9.89887343 10.22215909 10.52959169 10.78229764 10.94921423 11.01219312
 10.96898204 10.83359489 10.63400924 10.40756972 10.19485242 10.03299831
  9.94961111  9.95822208 10.05606687 10.22453968 10.43225015 10.64018073
 10.80809711 10.90115863]
Create a new sample of explanatory variables Xnew, predict and plot
[6]:
x1n = np.linspace(20.5, 25, 10)
Xnew = np.column_stack((x1n, np.sin(x1n), (x1n - 5) ** 2))
Xnew = sm.add_constant(Xnew)
ynewpred = olsres.predict(Xnew)  # predict out of sample
print(ynewpred)
[10.87960032 10.69855331 10.38191219  9.98412967  9.57688468  9.23153285
  9.00163619  8.90984922  8.94237236  9.05233055]
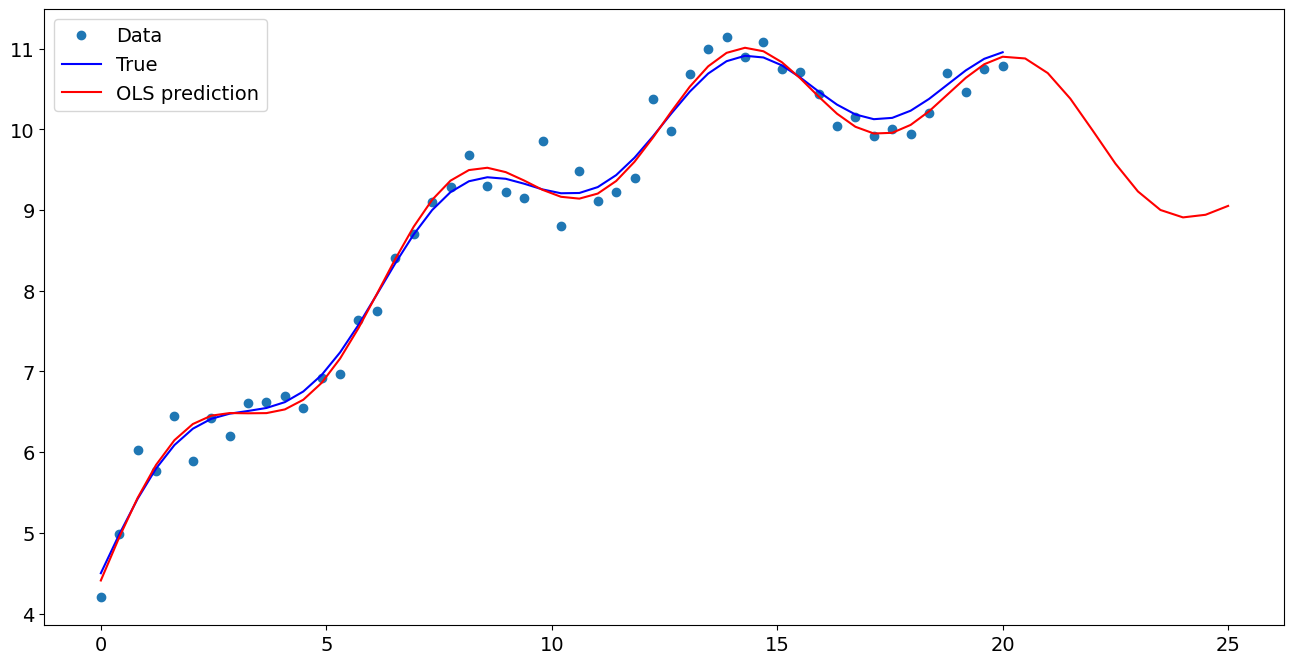
Plot comparison
[7]:
import matplotlib.pyplot as plt

fig, ax = plt.subplots()
ax.plot(x1, y, "o", label="Data")
ax.plot(x1, y_true, "b-", label="True")
ax.plot(np.hstack((x1, x1n)), np.hstack((ypred, ynewpred)), "r", label="OLS prediction")
ax.legend(loc="best")
[7]:
<matplotlib.legend.Legend at 0x7fc0436f7010>

Predicting with Formulas
Using formulas can make both estimation and prediction a lot easier
[8]:
from statsmodels.formula.api import ols

data = {"x1": x1, "y": y}

res = ols("y ~ x1 + np.sin(x1) + I((x1-5)**2)", data=data).fit()
We use the I to indicate use of the Identity transform. Ie., we do not want any expansion magic from using **2
[9]:
res.params
[9]:
Intercept           4.948842
x1                  0.512418
np.sin(x1)          0.609303
I((x1 - 5) ** 2)   -0.021566
dtype: float64
Now we only have to pass the single variable and we get the transformed right-hand side variables automatically
[10]:
res.predict(exog=dict(x1=x1n))
[10]:
0    10.879600
1    10.698553
2    10.381912
3     9.984130
4     9.576885
5     9.231533
6     9.001636
7     8.909849
8     8.942372
9     9.052331
dtype: float64